


KULDNE KARIKAS
DATA DESIGN
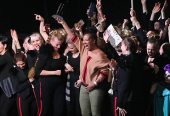
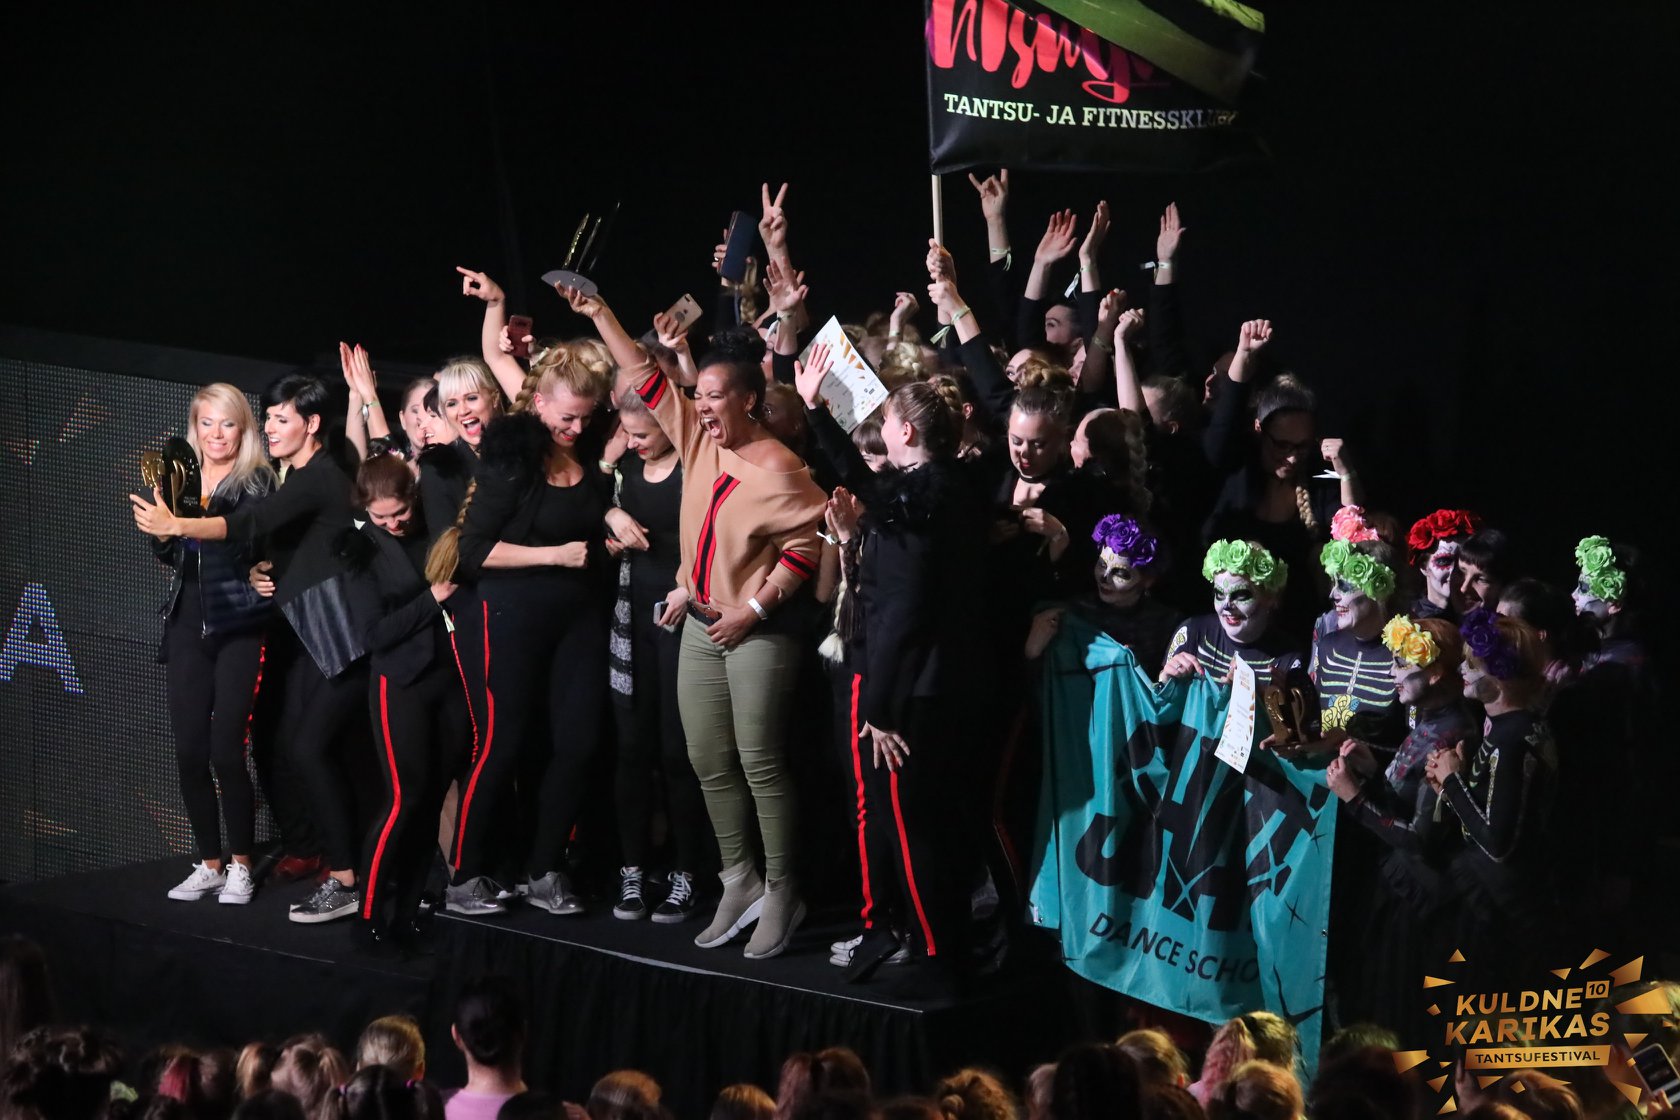
Kuldne Karikas is one of the culminating events of the dance year for dancers in Estonia. Through preliminary rounds, the best dances of the year make it to the finals of the Kuldne Karikas, which is the big final event.
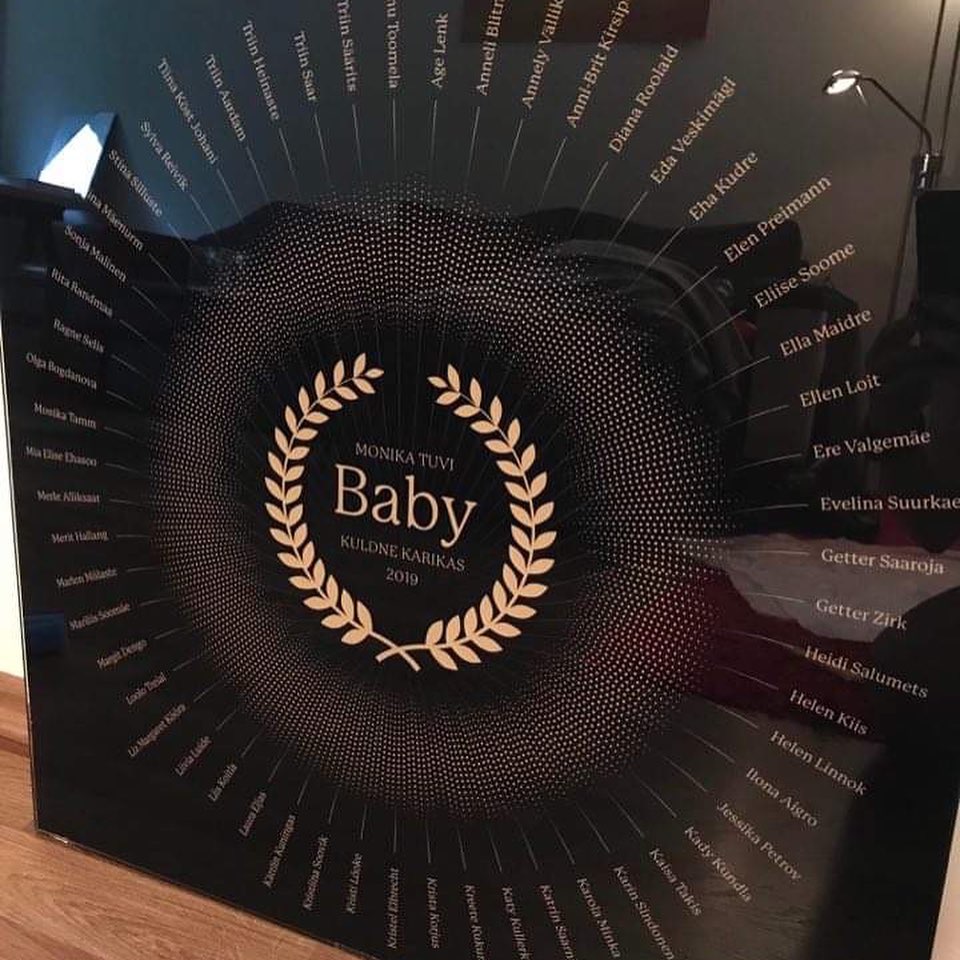
For the past three years I've been taking dancing classes in Tantsugeen, focussing on Club Freestyle with Monika Tuvi. In 2019, we competed in the Kuldne Karikas with our performance of "Baby" and were thrilled to come out on top. In addition to the trophy that we got from the dance festival, I decided to make one of our own. This is our personal trophy and present for our badass dancing coach and choreographer Monika in order to show our love and appreciation for this achievement. Kudos!
WHAT IS DATA DESIGN
Data design is all about making complex information easy to understand by using visuals and text. This includes things like typography, colors, and layouts to create a clear and appealing design. I love the process of crafting compelling representations of information, which effectively communicate complex data or concepts to a targeted audience.

CONCEPT x PROCESS
PARAMETERS & TOOLS
I had four different parameters of data to work with:
- Monika as the key character in the whole project
- The event itself and the time of occurance
- The dancers/participants
- The visualized soundwave of our performance
In order to get a waveform image from our performance's audio file, I used Waveformer which allowed to download the processed data as a SVG file. I combined all other parameters with a free and open source tool for data visualization. RAWGraphs has a wide range of charts with almost 30 visual models to visualize quantities, hierarchies, time series and find insights in your data.

PROCESS
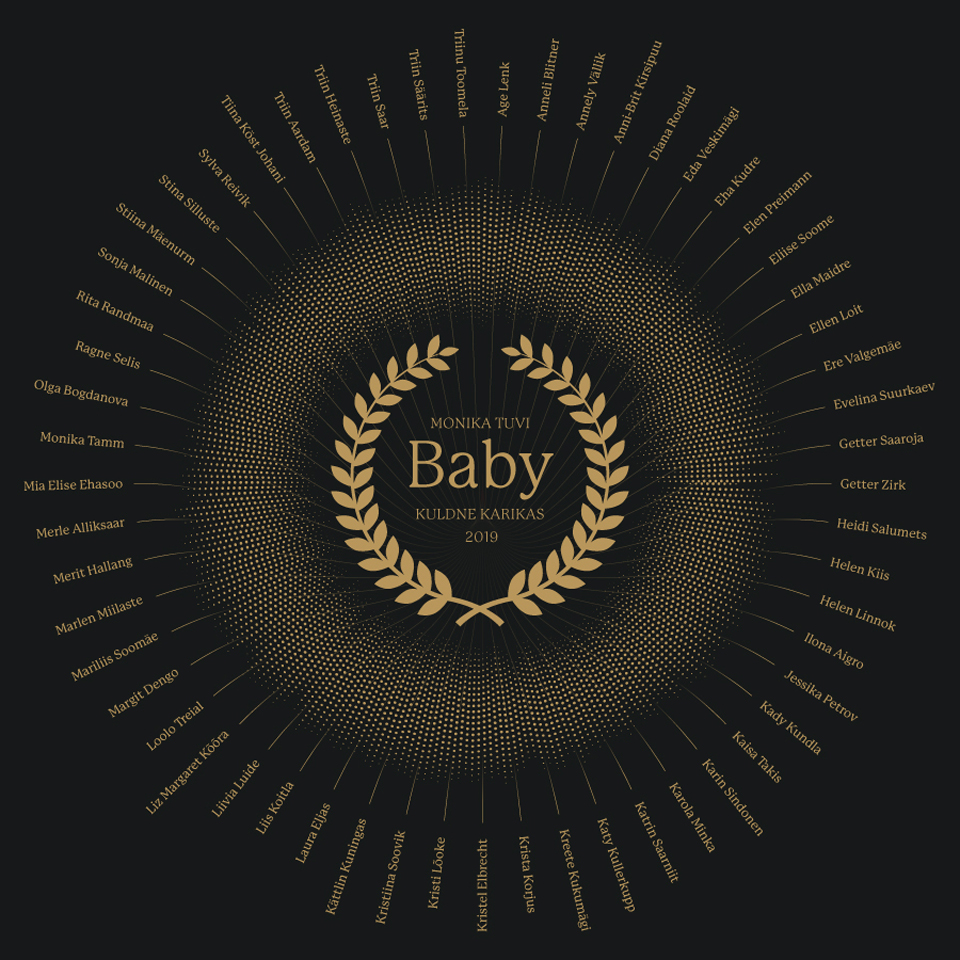
For my project, I decided to use a dendrogram chart to visualize and classify taxonomic relationships. It is frequently used to illustrate the arrangement of clusters produced by hierarchical clustering. The name "dendrogram" comes from the ancient Greek words "déndron" and "grámma," meaning "tree" and "drawing." I pulled the results from RawGraphs into Illustrator and began to experiment with the raw assets of the tree and soundwave. Instead of presenting this information horizontally, which for example is a default shape of soundwaves, I decided to turn all this data into a radial visualisation. Let's see how the audio clip turned into a circular soundwave.
First, I uploaded the audioclip into Waveformer and saw it doing its magic.
Then I imported the downloaded SVG into Illustrator and gave the default and boring soundwave a new and softer look.

And finally I turned the horizontal bar into a cirle.

I designed the information in black and gold colour scheme. This trophy was printed on a 60x60 cm high quality glass with a black metal frame by Glasstech.
OTHER MONIKA TUVI RELATED DESIGNS
A logo for Tuvi & Kajakad, printed on a glitter material at my favourite sticker shop StickerApp!
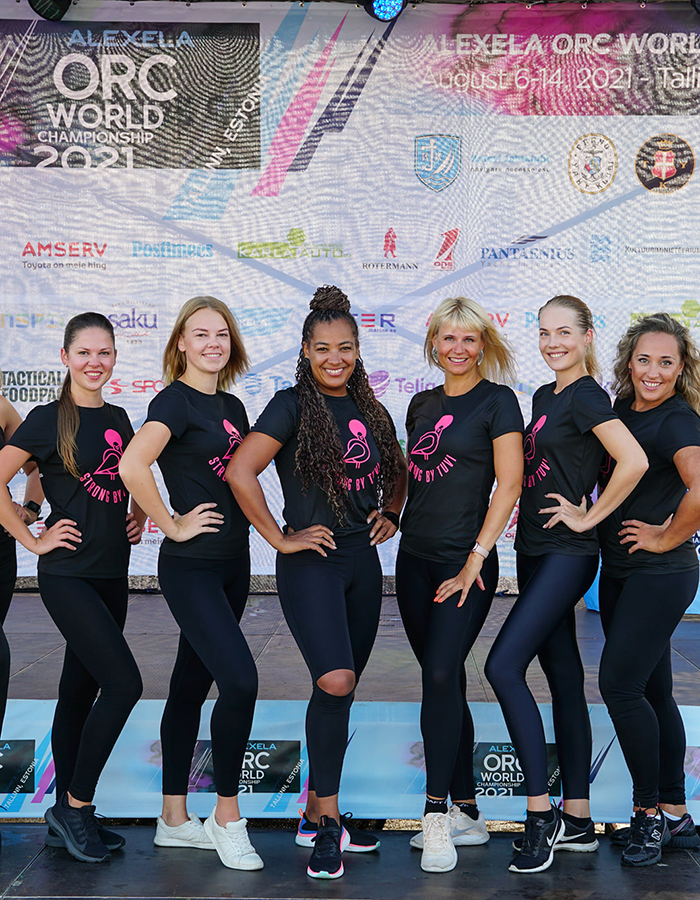
A STRONG BY TUVI logo designed for our summer dance camp and performance which we printed on black T-shirts!
Thanks for reading & stay awesome!
Hi I'm Ragne
I work with people who care deeply about what they're building. If that's you—hello. 👋
Drop me a line!
I will respond within a day